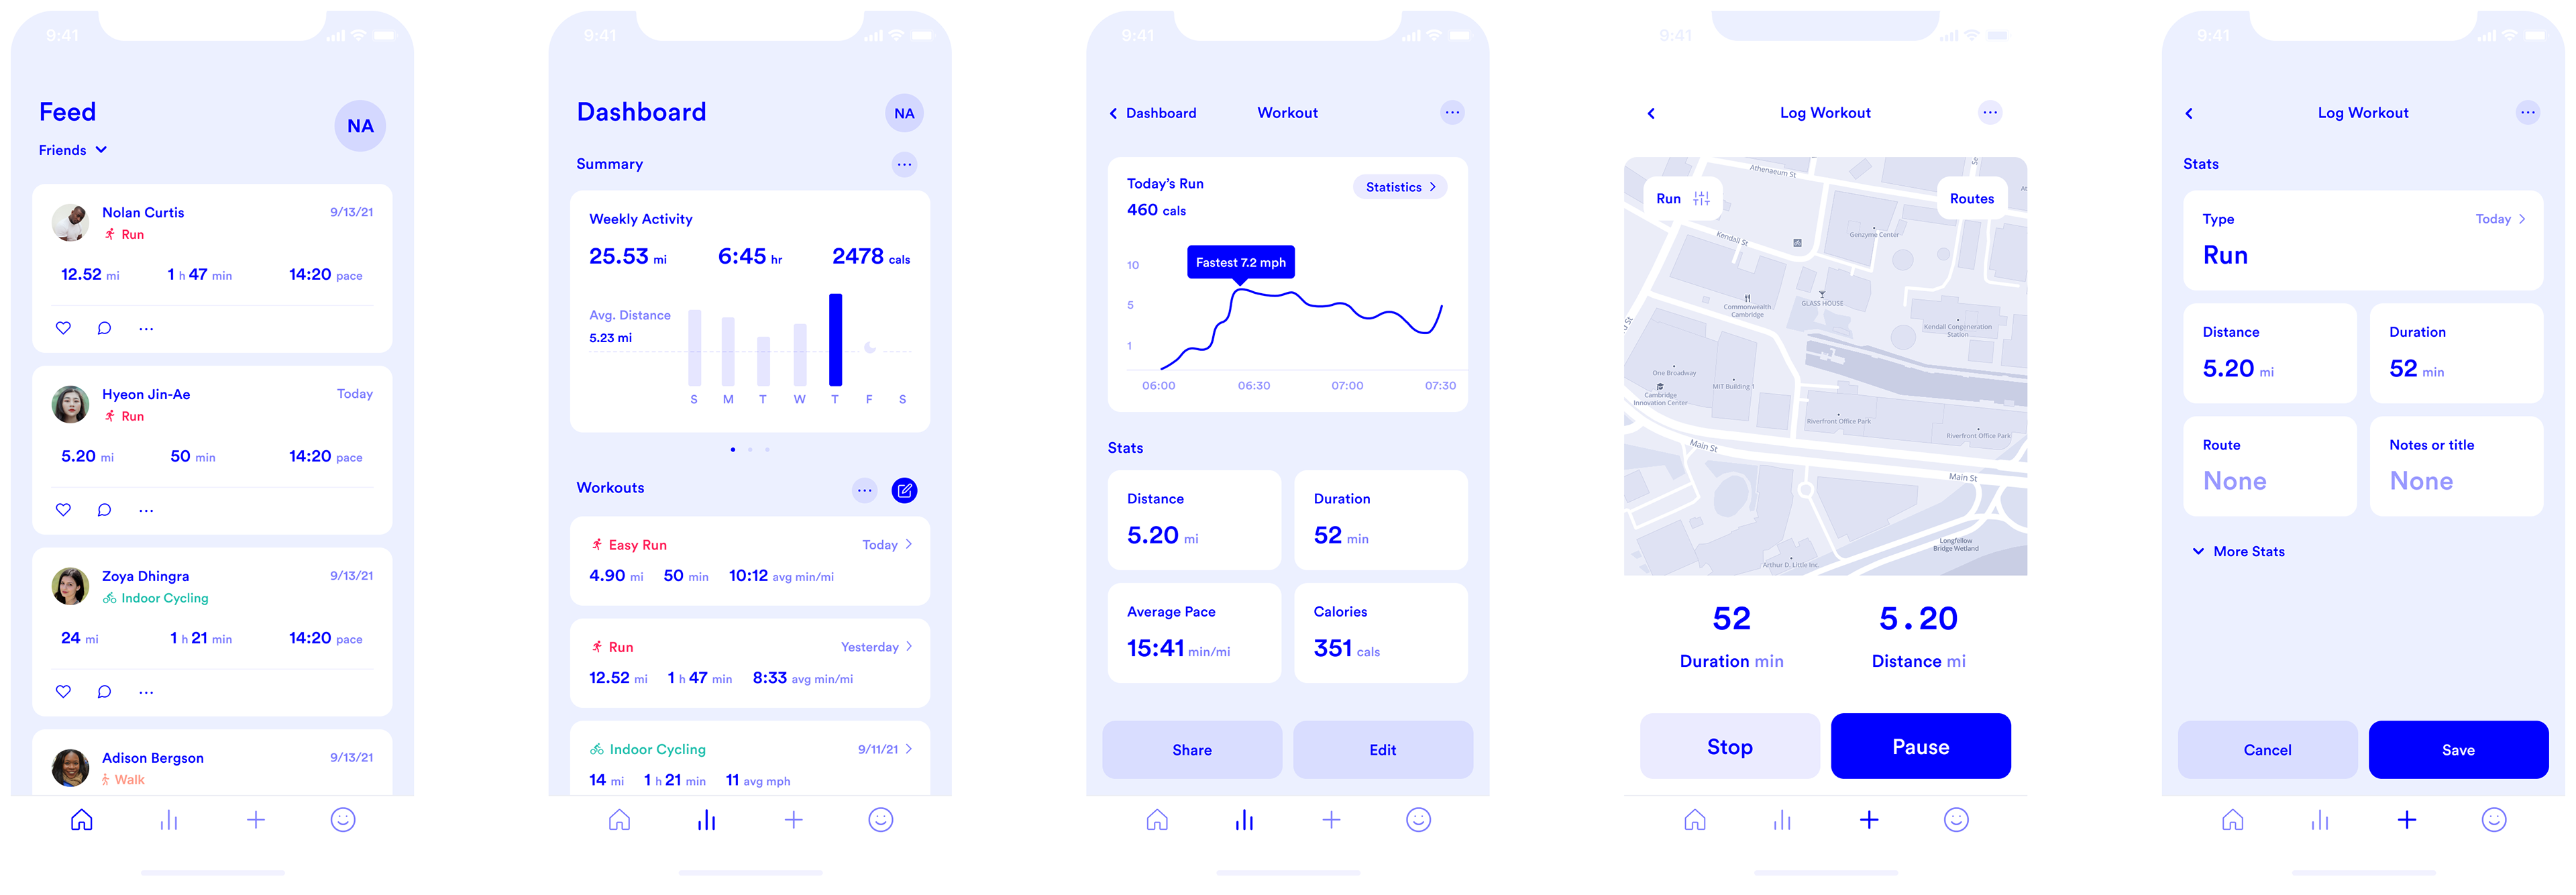

I wanted to try designing a run tracker app that focuses on the bare-bones of logging and calculating information. The Under Armour app I've used (simply because it has ten years of data) feels overloaded with slow-loading screens, social feeds I don't need, and repetitive sections and data.
I only use the live map tracker or "Log Workout" screens for daily runs, and occasionally I look at past activity. It's frustrating that these screens are hidden behind menus or the social feed, and not accessible right away.
With that in mind, I removed redundant information and reorganized the info hierarchy. The app is condensed into Feed, Dashboard and Workouts, and Log Workout sections.
With that in mind, I removed redundant information and reorganized the info hierarchy. The app is condensed into Feed, Dashboard and Workouts, and Log Workout sections.
Design
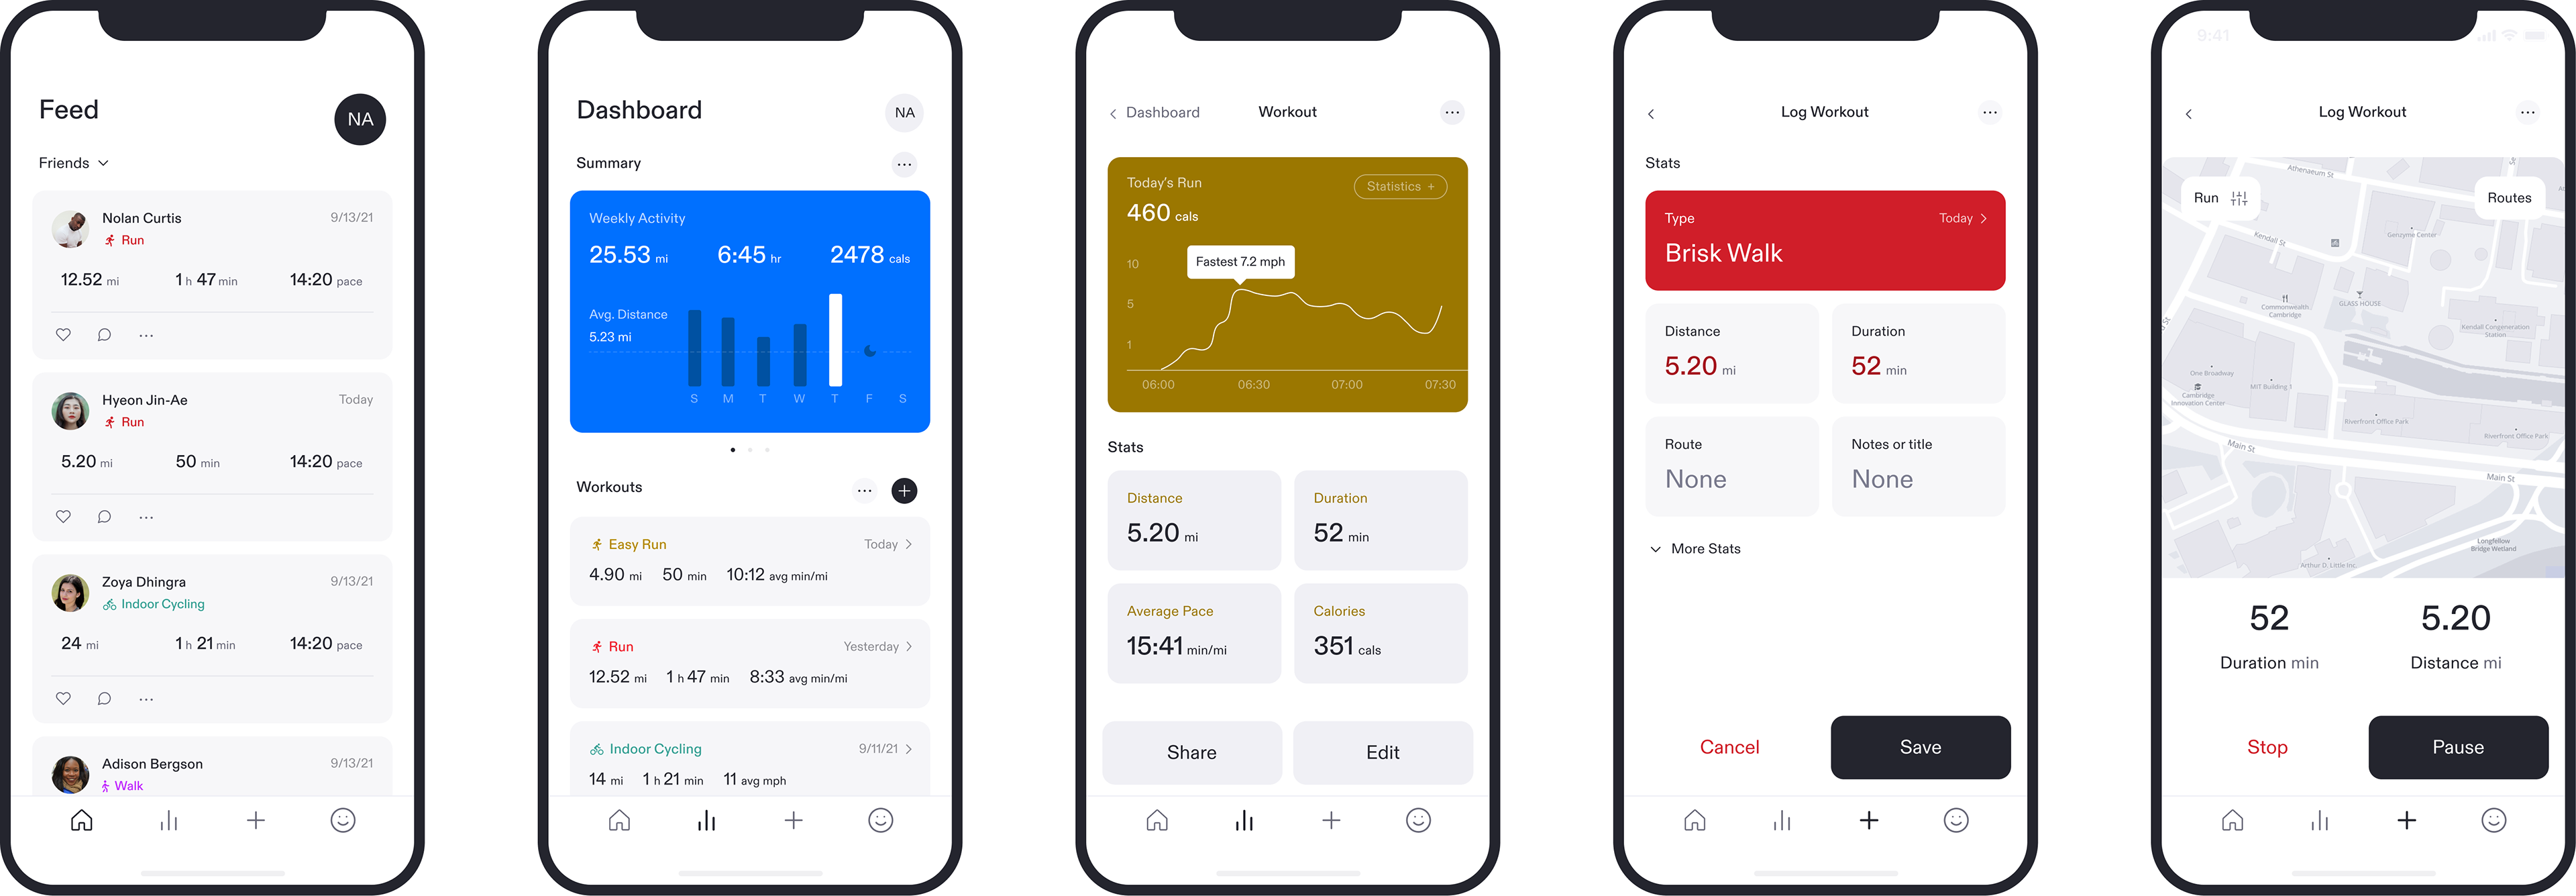
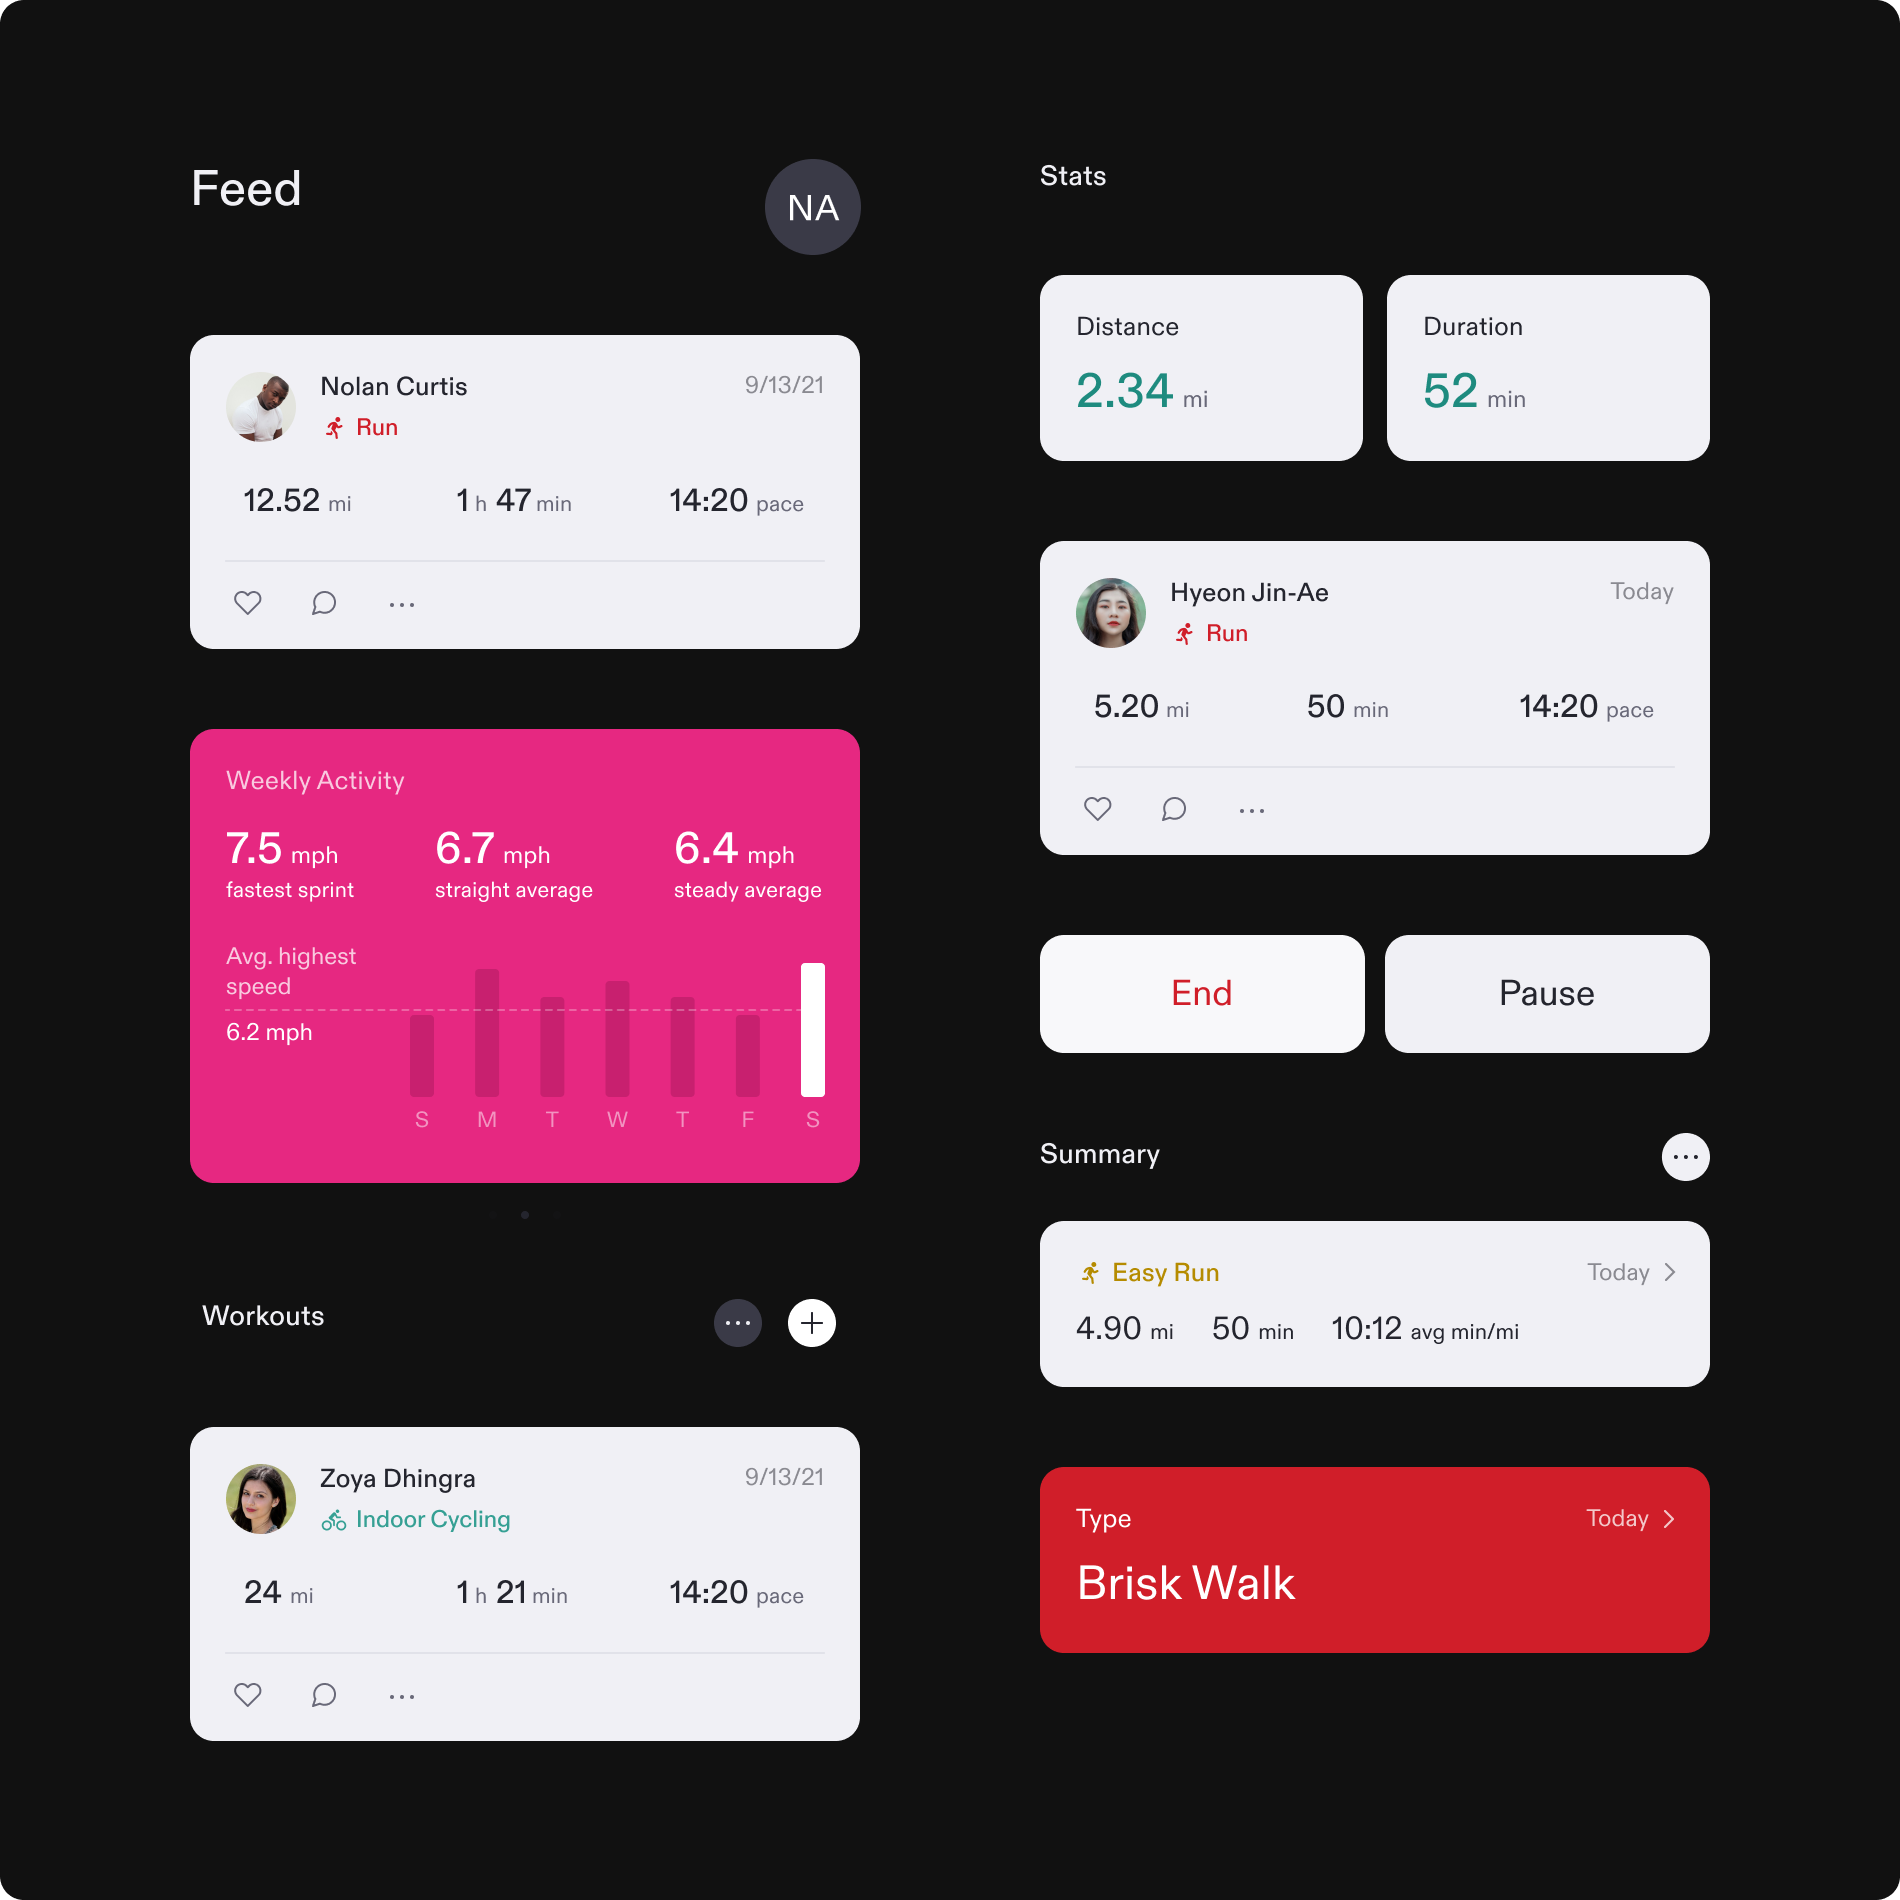
Dashboard
Users can swipe through Summary cards at the top of the Dashboard to break down changes in habit and performance—total activity over a timeframe, speed and efficiency, distance, etc.
Users can swipe through Summary cards at the top of the Dashboard to break down changes in habit and performance—total activity over a timeframe, speed and efficiency, distance, etc.
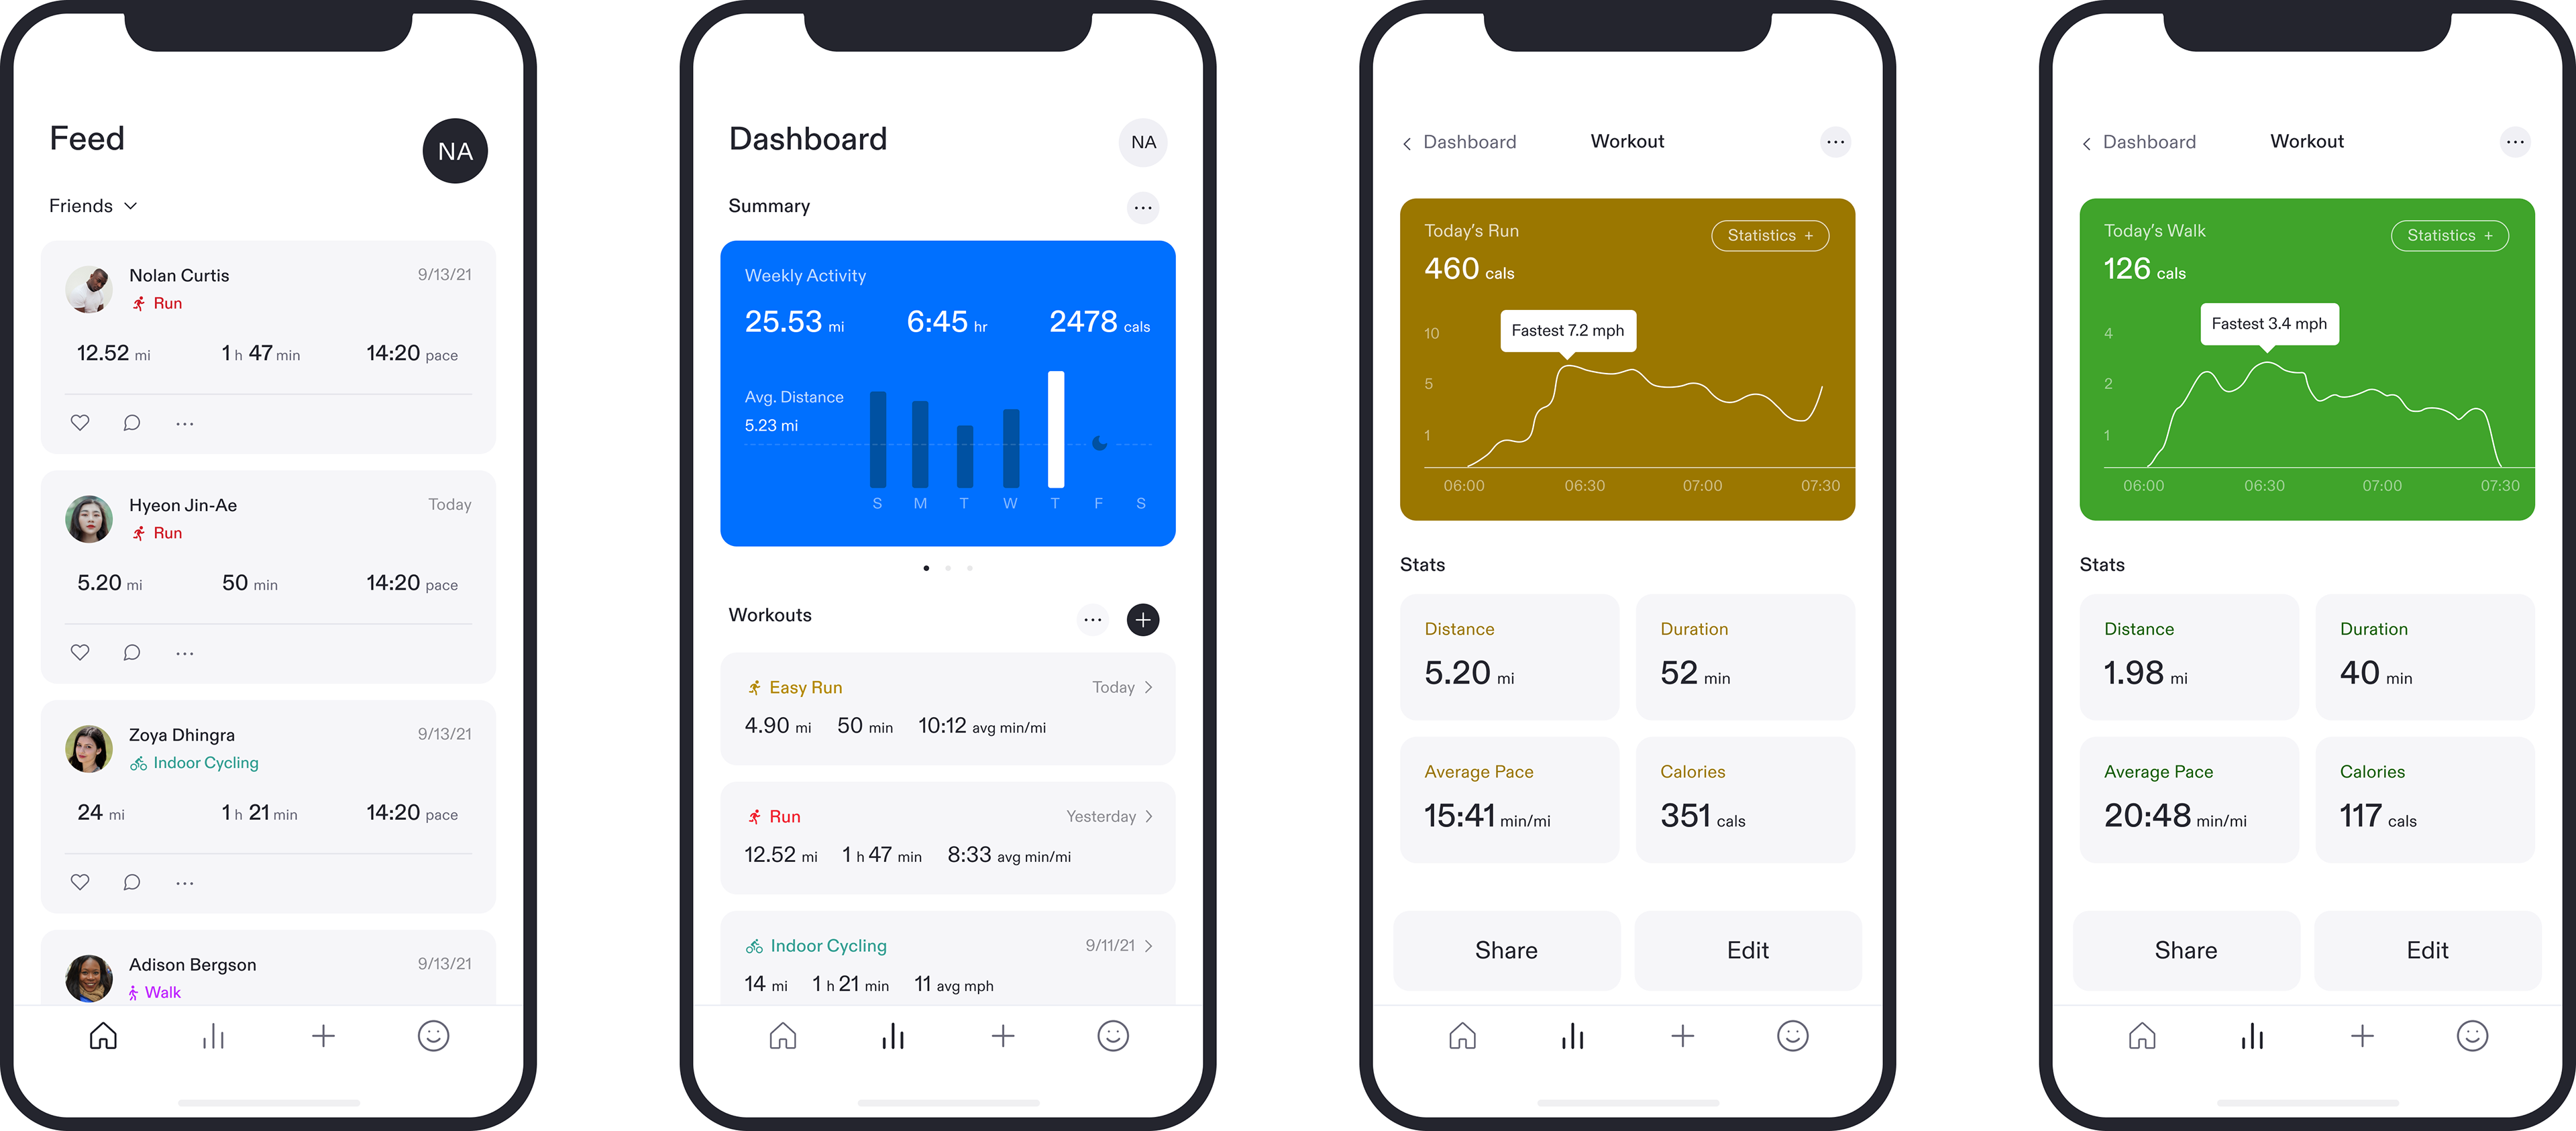
Workout
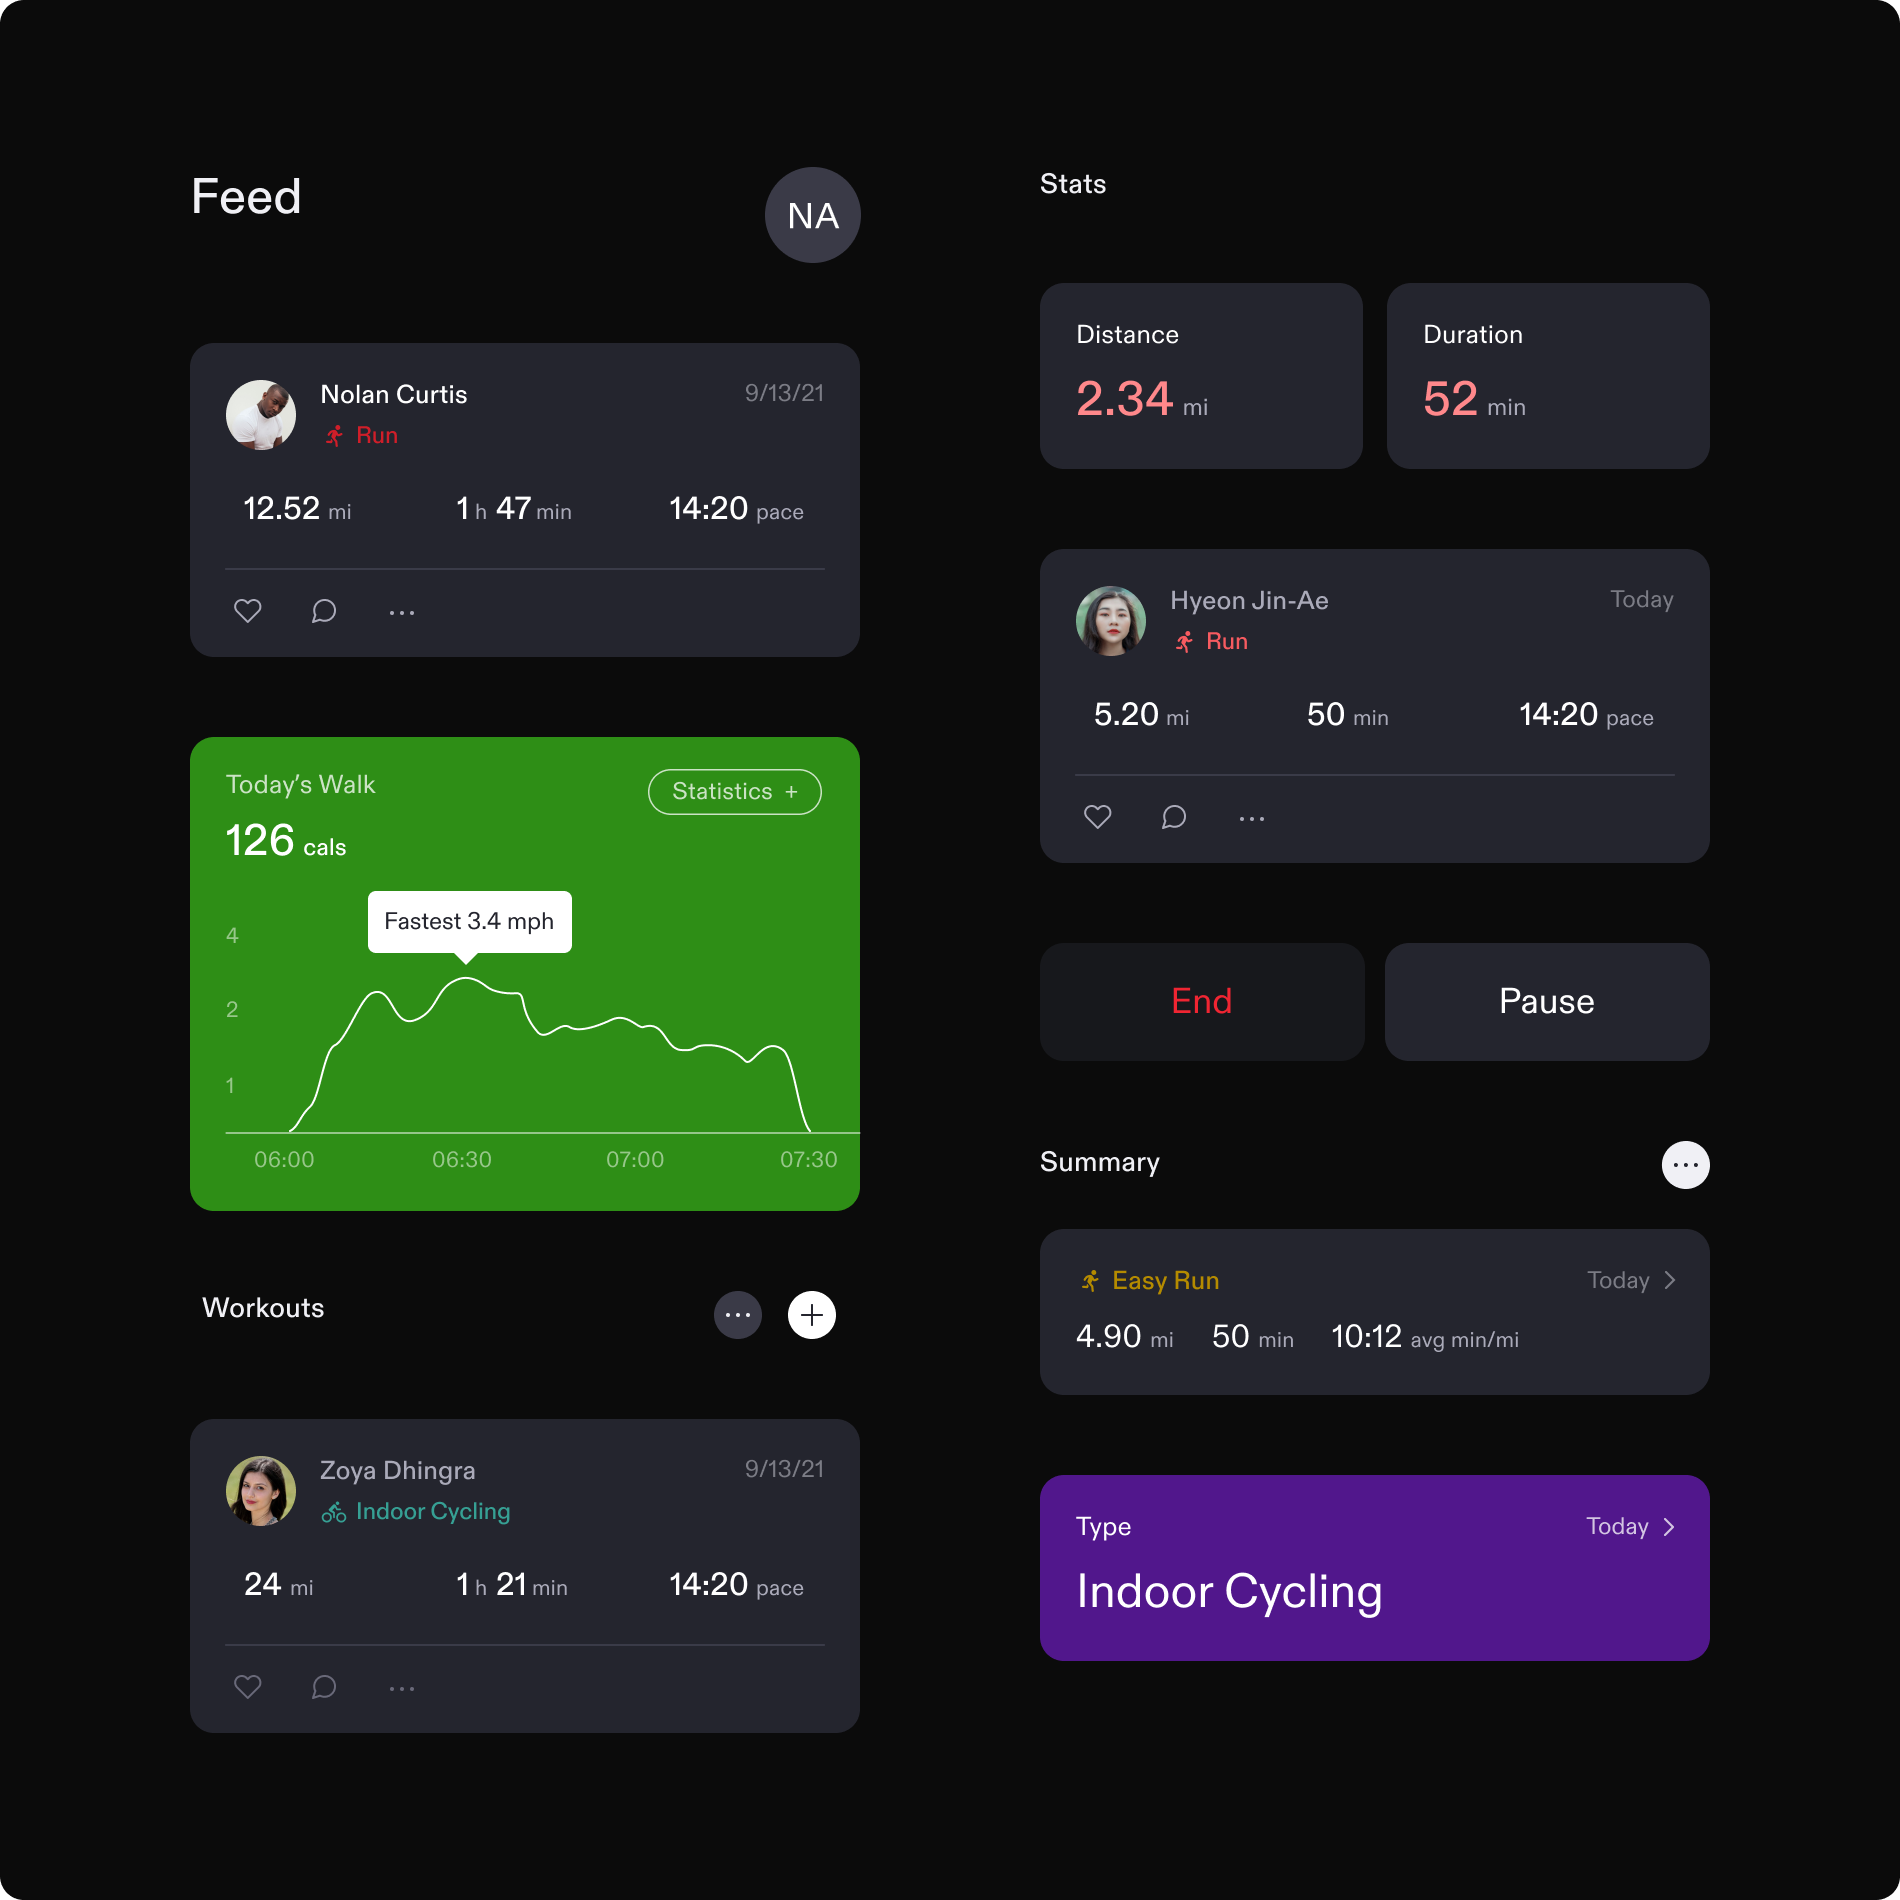
Users may tap to view individual workouts. This page prioritizes the most important differentiating information. The chart shows a visual breakdown of performance, with the default metric being Speed over time for most workouts, and a Statistics button to show m
Users may tap to view individual workouts. This page prioritizes the most important differentiating information. The chart shows a visual breakdown of performance, with the default metric being Speed over time for most workouts, and a Statistics button to show m
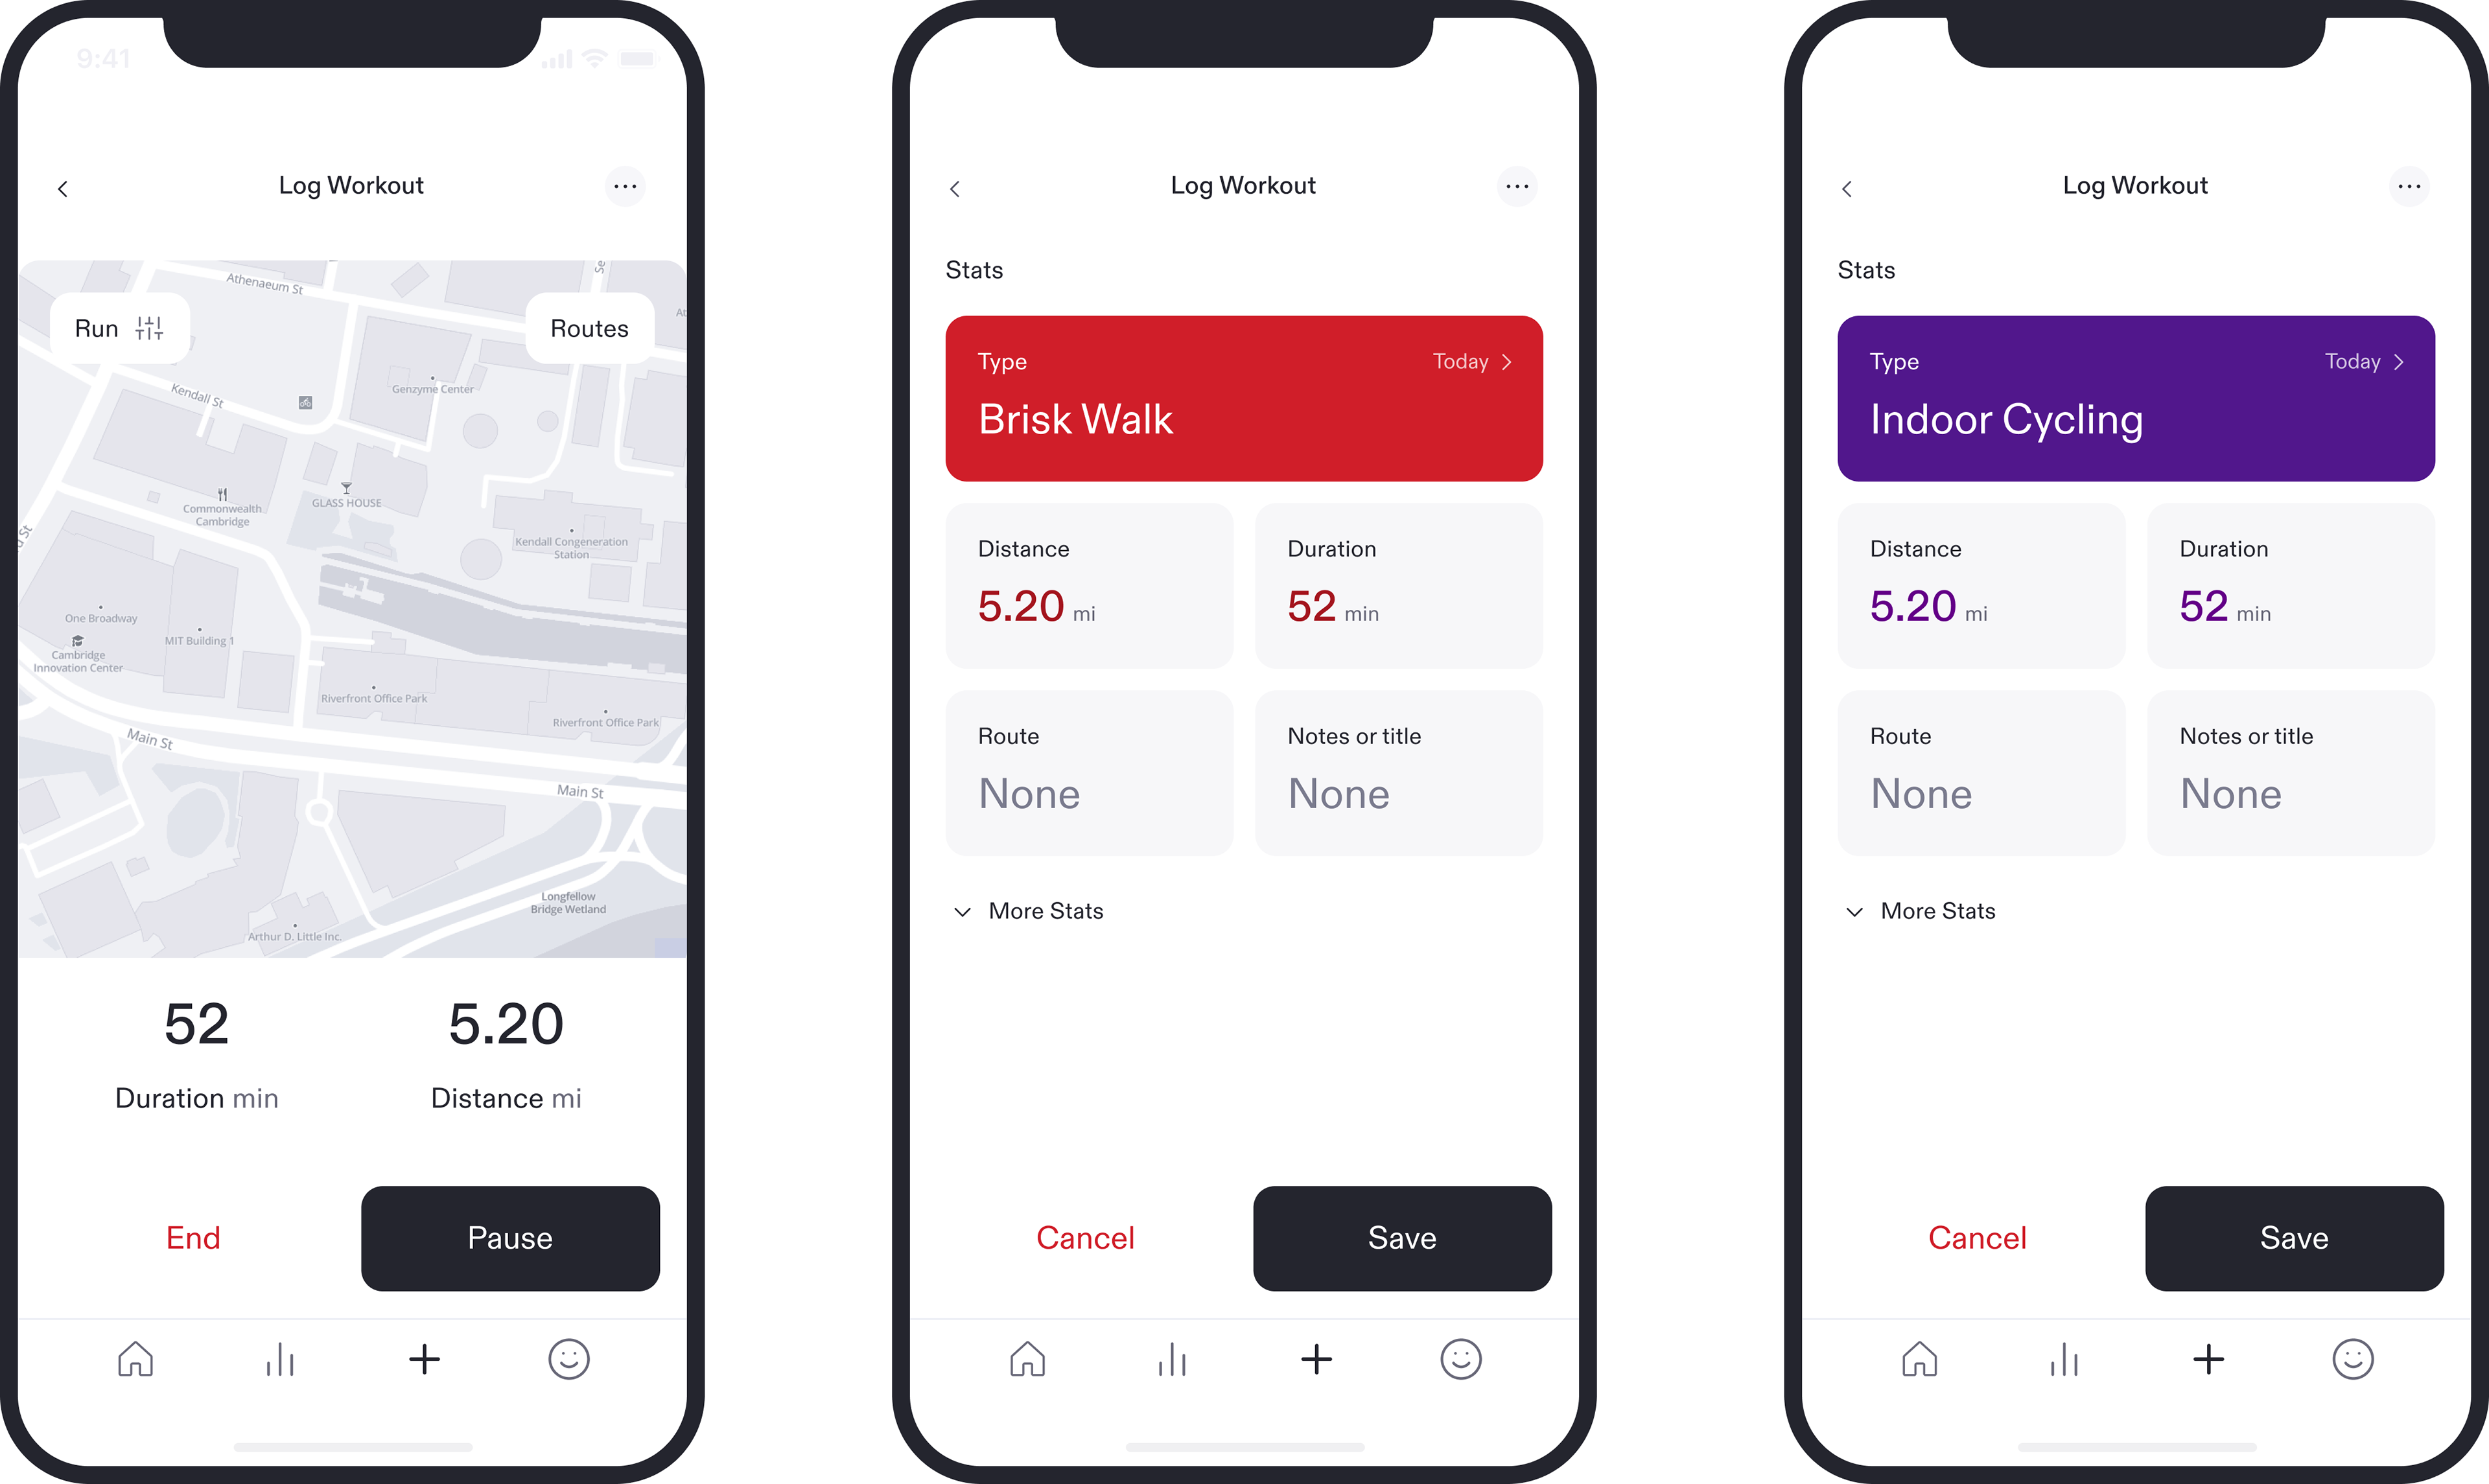
Log Workout
The Log Workout screens let users track outdoor (real-time) or indoor (usually user-input-based) activities. These aren't fully resolved, as I'd like them to be on one screen.
The Log Workout screens let users track outdoor (real-time) or indoor (usually user-input-based) activities. These aren't fully resolved, as I'd like them to be on one screen.
Other cards
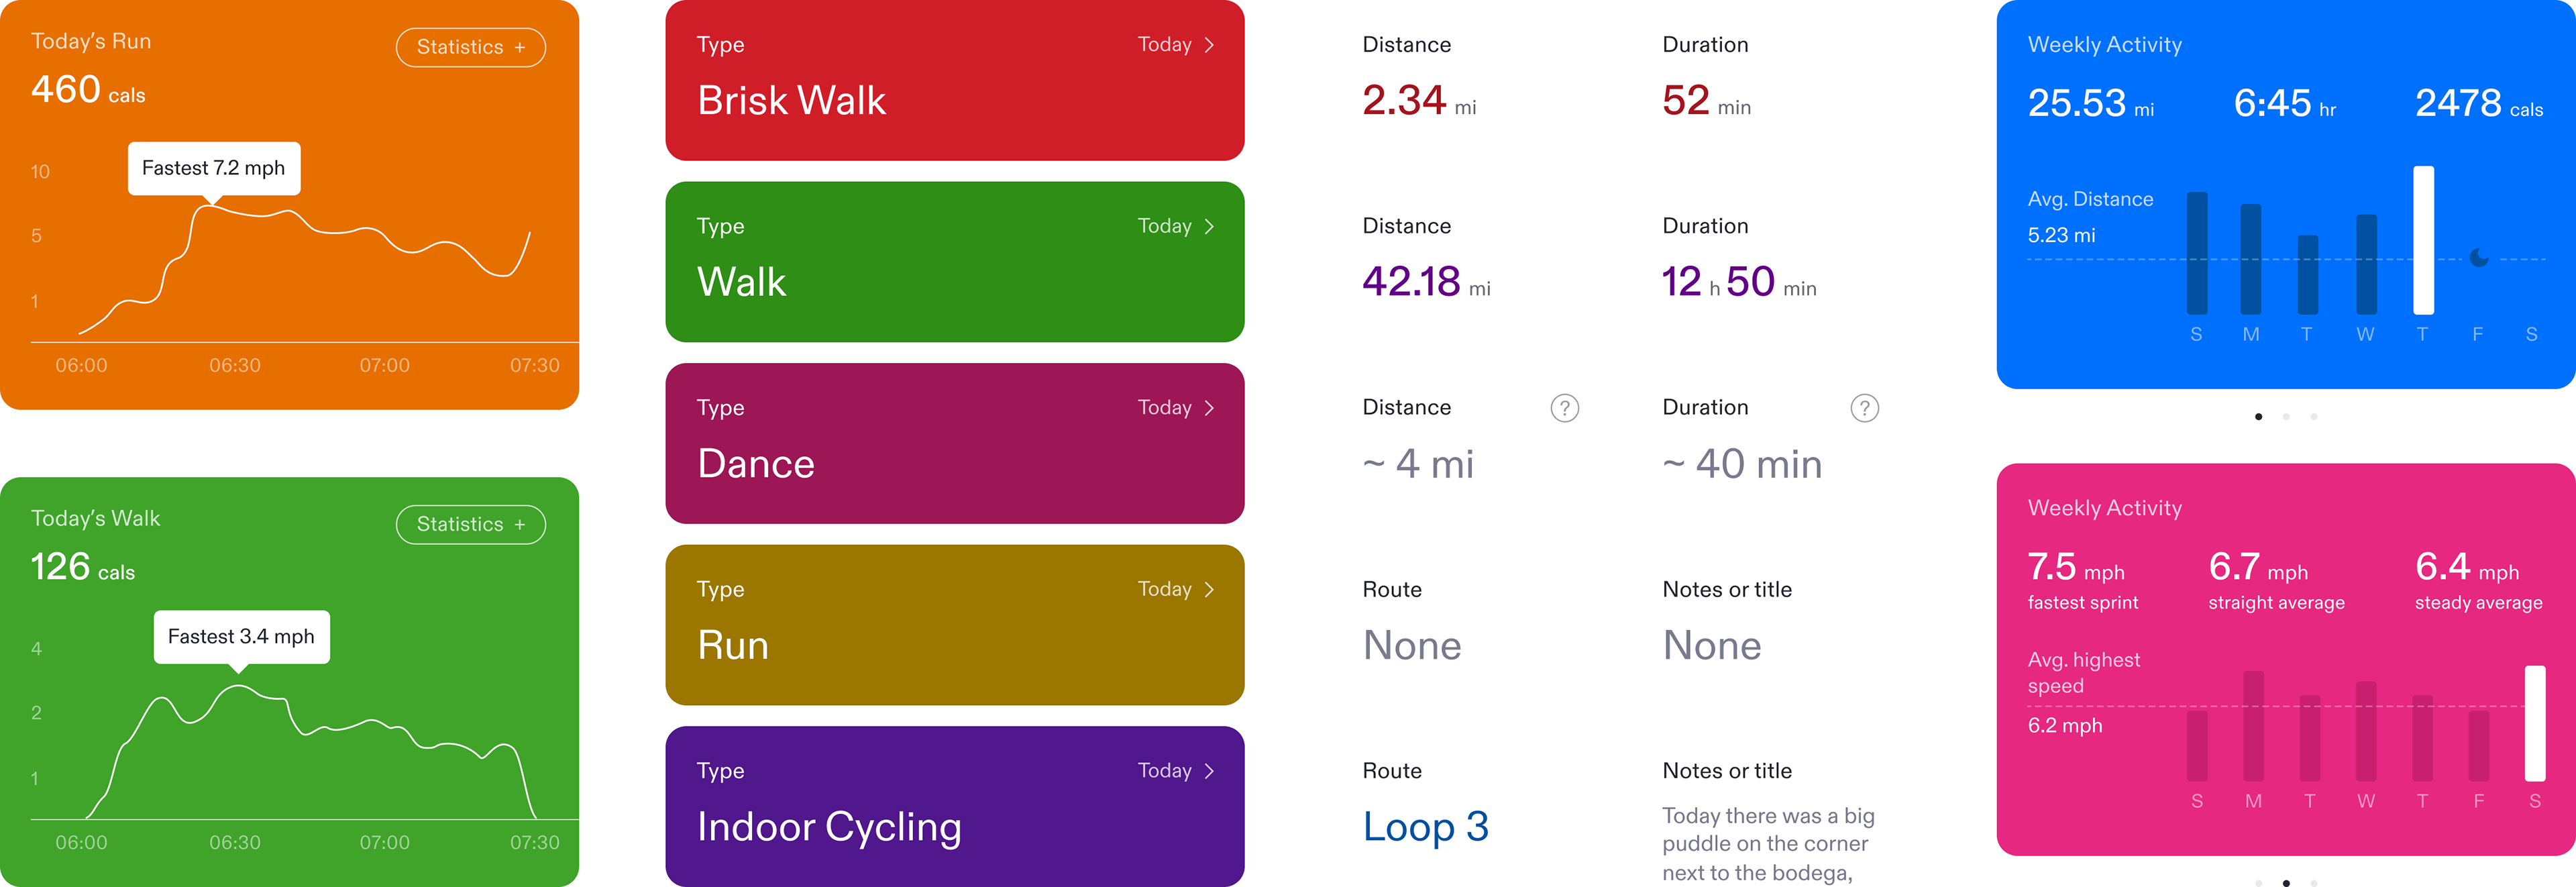
Older/alternate idea